Dividend Strategy Factsheet
Firm Overview
Alpine Saxon Woods is an emerging investment firm based in Purchase, NY, with over $843 million in AUM. Our clients include foundations, trusts, and high-net-worth individuals. With a heritage spanning 25+ years, our partners have worked together for well over a decade. We offer several strategies—Large and Small Dividend, Capital Return, Small Cap Growth, Core Momentum and Balanced—available in long only, long/short, and institutional accounts. Our portfolios focus on high-quality companies with strong free cash flow and momentum.
Overview
The Dividend strategy invests in companies that maintain or increase their dividends. Fundamental research is performed on each company’s ability to sustain its dividend and potentially increase those payments in the future, incorporating analysis on free cash flow and numerous balance sheet metrics. The strategy is market capitalization and sector agnostic, but the nature of dividend paying companies tends to tilt towards a large-to-mid capitalization profile.
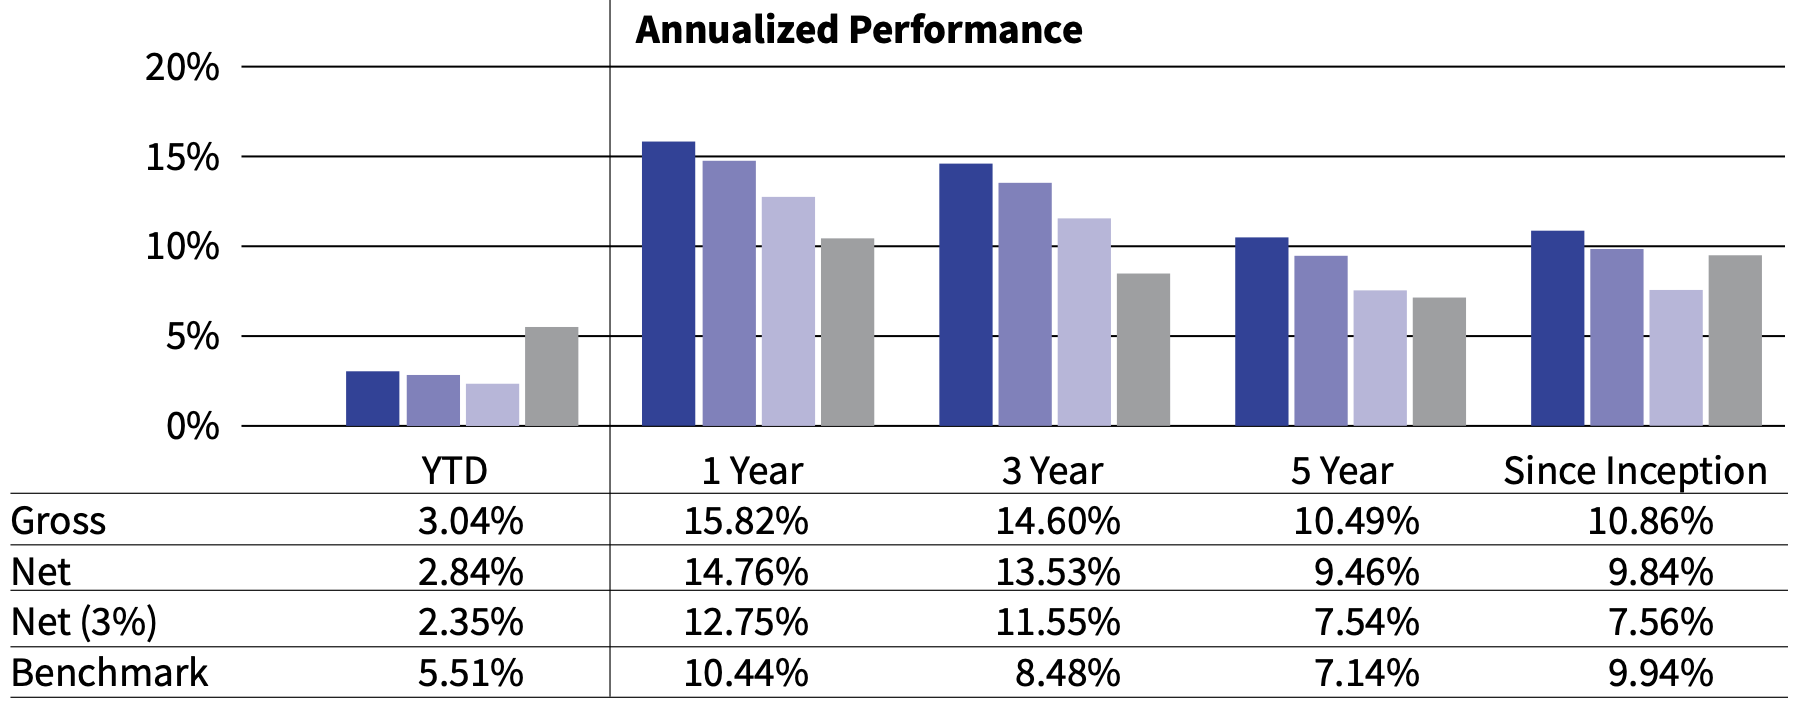
Performance (As of 3/31/26)
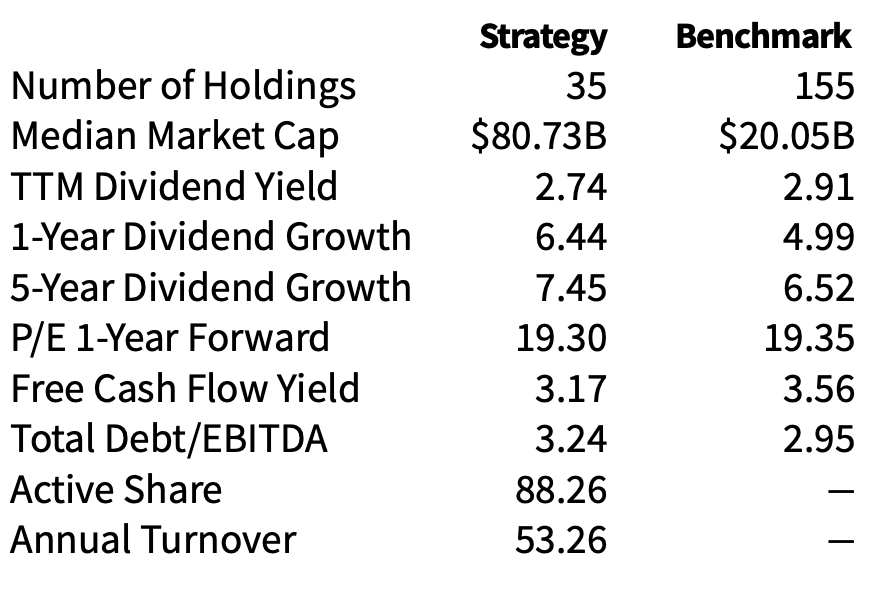
Portfolio Characteristics
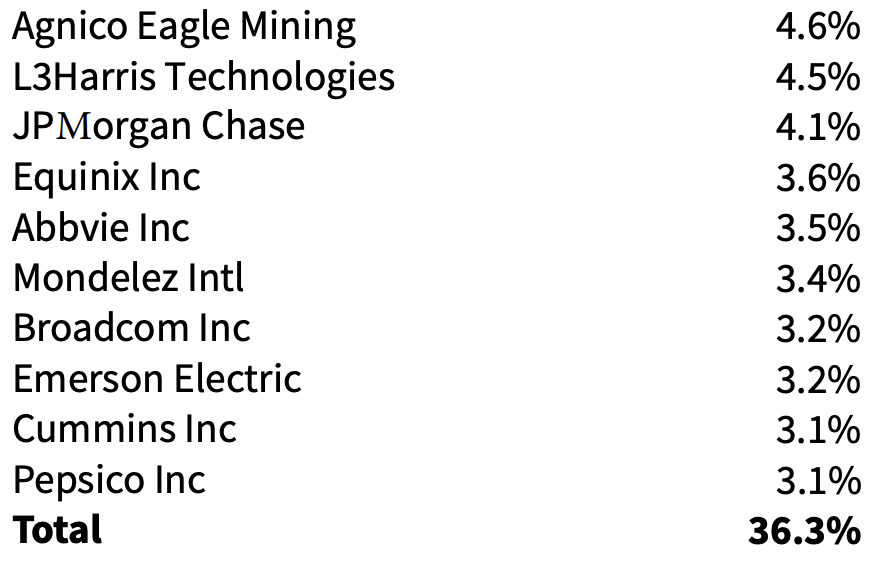
Top Ten Holdings
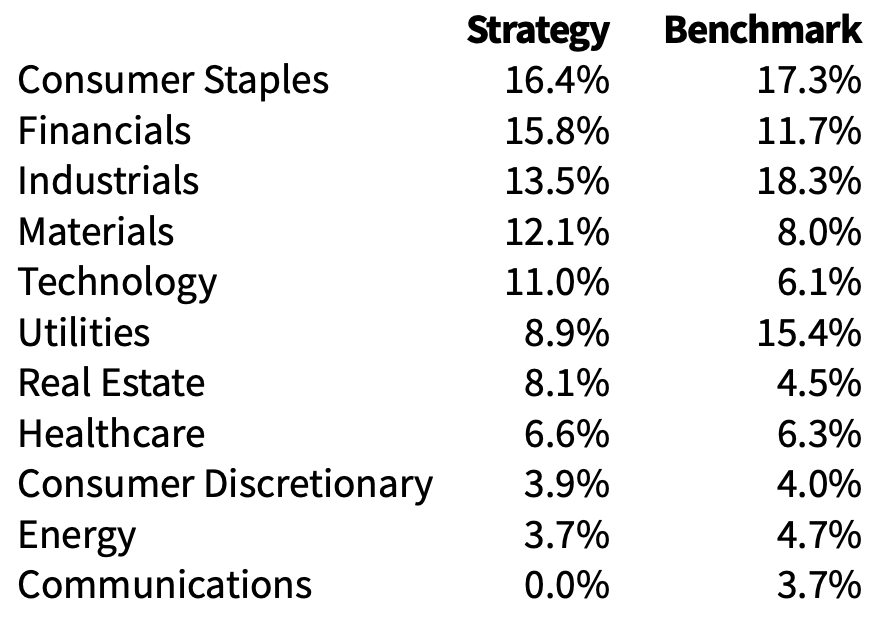
Sector Analysis
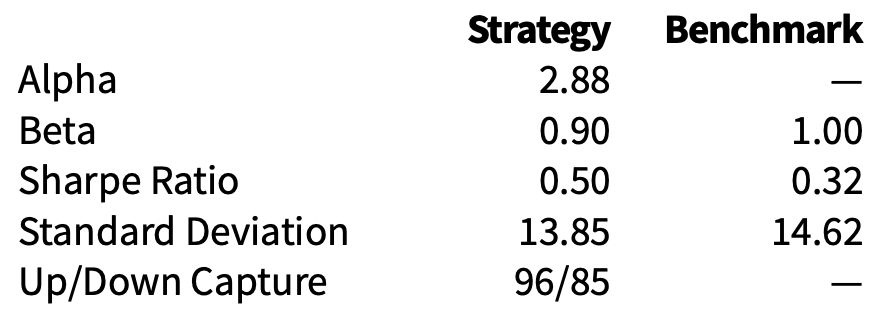
Risk/Return Metrics1
Past performance is no guarantee of future results. The use of Alpine Saxon Woods does not eliminate risks associated with investing. Consider the investment objectives, risks, charges, and expenses carefully before investing. The return and principal value of an investment will fluctuate and may be worth less than the original investment when liquidated.
Fees: Results are presented showing, side-by-side, gross returns, returns net of actual composite fees, and returns net of fees modeled at 3% (see below). The highest fee applicable for a separately managed portfolio managed directly by Alpine Saxon Woods is 1.0% annually. Gross-of-fee return reflects performance after the reduction of transaction costs but before the reduction of the management fee. Net-of-fee (Net) returns reflect the deduction of all transaction costs and management fees to accounts in the composite. Net (3%) returns is reduced by a model “wrap fee” (3.0% is the maximum anticipated wrap fee for equity and balanced portfolios) which includes trading expenses as well as investment management, administrative and custodial fees. The model wrap fee used represents the highest anticipated wrap fee applicable to the strategy. Actual fees and account minimums may vary.
Alpine Saxon Woods, LLC is an independent asset management firm established in 2022 and based in Purchase, NY. The firm history begins in 2019 with the predecessor firm, Alpine Woods L.P. Alpine Saxon Woods is the parent company of two registered investment advisors, Alpine Woods Capital Investors, LLC and Saxon Woods Advisors, LLC. The firm takes a thematic and tailored approach to investing, with a focus on underappreciated growth.
Performance: Periods less than one year are not annualized. Performance results are for the Dividend Strategy composite which includes all actual, fully discretionary accounts with substantially similar investment policies and objectives managed to the composite’s investment strategy. Composite returns are stated in U.S. dollars and assume reinvestment of any dividends, interest income, capital gains, or other earnings.
For fee schedules, contact your financial professional. Management and performance of individual accounts may vary for reasons that include the existence of different implementation practices and model requirements in different investment programs. To obtain specific information on available products and services or a GIPS® Report, contact your Alpine Saxon Woods separately managed account sales team at (914) 251-0880. Alpine Saxon Woods claims compliance with the Global Investment Performance Standards (GIPS®). GIPS® is a registered trademark of CFA Institute. CFA Institute does not endorse or promote this organization, nor does it warrant the accuracy or quality of the content contained herein.
Additional information regarding policies for calculating and reporting returns is available upon request. Investing involves risks and portfolios can lose value. Past performance is no guarantee of future results.
As a benchmark, the strategy uses the SPDR S&P Dividend ETF (SDY). The SDY tracks the performance of the S&P High Yield Dividend Aristocrats Index.
Alpine Saxon Woods, 2500 Westchester Avenue, Purchase, NY 10577.
Definitions:
Median Market Cap is the midpoint of market capitalization (market price multiplied by the number of shares outstanding) of the stocks in a portfolio. Half the stocks in the portfolio will have higher market capitalizations; half will have lower.
TTM (Trailing Twelve Month) Dividend Yield is calculated by dividing the total dividends paid out over the previous 12 months by the current market price of the stock. Median market cap is the midpoint of market capitalization (market price multiplied by the number of shares outstanding)) of the stocks in a portfolio. Half the stocks in the portfolio will have higher market capitalizations; half will have lower.
Dividend growth refers to the compound annual growth rate in dividends per share that a company pays to its shareholders
Forward P/E ratio is calculated by dividing a company’s current share price by its estimated future earnings per share.
Free cash flow yield is calculated by dividing a company’s annual free cash flow per share by its market price per share.
Total Debt/EBITDA is calculated by dividing a company’s total debt (shortterm plus long-term) by its earnings before interest, taxes, depreciation and amortization (EBITDA).
Active Share quantifies how much a portfolio differs from its benchmark index, and it is based on the portfolio’s holdings and their corresponding weights compared to the weights of the same holdings in the benchmark index.
Annual Turnover is calculated by dividing the average of the absolute value of assets purchased and sold during the year by the average assets in the portfolio over the same year.
Alpha measures the performance of a portfolio versus its benchmark on a risk-adjusted basis. It is calculated by subtracting the portfolio’s expected return based on the Capital Asset Pricing Model formula Rf + β (Rm-Rf ) from the actual return of the portfolio, where Rf is the return on risk-free Treasury bills, Rm is the benchmark return and β is the beta of the portfolio as defined below.
Beta measures the sensitivity of a portfolio to the movement of its benchmark. It is calculated as the slope of a regression of historical portfolio returns against the returns of the benchmark.
Sharpe ratio is calculated by dividing a portfolio’s excess return by its standard deviation, using the formula (Rp - Rf ) / σp where Rp is the portfolio’s return, Rf is the return on risk-free Treasury bills, and σp is the standard deviation of the portfolio’s return. The higher the Sharpe ratio, the better a portfolio’s historical risk-adjusted performance.
Standard deviation measures the risk or volatility of an investment’s return over a particular time period: the greater the number, the greater the risk. The volatility, or uncertainty, of future returns is a key concept of investment risk. Standard deviation is a measure of volatility and represents the variability of individual returns around the mean, or average annual, return. A higher standard deviation indicates more return volatility. This measure serves as a collective, quantitative estimate of risks present in an asset class or investment. Some risks may be underrepresented by this measure. Standard deviation is an underlying calculation for many other performance-based statistics including alpha, beta, and Sharpe ratio.
The up-capture ratio is calculated by dividing a portfolio’s compounded returns during periods when its benchmark was rising by the benchmark’s compounded returns during those same periods. An up-capture ratio of more than 100 indicates that the portfolio outperformed its benchmark during periods when the benchmark had positive returns.
The down-capture ratio is calculated by dividing a portfolio’s compounded returns during periods when its benchmark was falling by the benchmark’s compounded returns during those same periods. A down-capture ratio of less than 100 indicates that the portfolio outperformed its benchmark during periods when the benchmark had negative returns.
Composite Time-Weighted Return Report
Dividend

Alpine Saxon Woods, LLC claims compliance with the Global Investment Performance Standards (GIPS®) and has prepared and presented this report in compliance with the GIPS standards. Alpine Saxon Woods, LLC has been independently verified for the periods January 1, 2019, through December 31, 2025.
A firm that claims compliance with the GIPS standards must establish policies and procedures for complying with all the applicable requirements of the GIPS standards. Verification provides assurance on whether the firm’s policies and procedures related to composite and pooled fund maintenance, as well as the calculation, presentation, and distribution of performance, have been designed in compliance with the GIPS standards and have been implemented on a firm-wide basis. The Dividend composite has had a performance examination for periods beginning January 1, 2019, through December 31, 2025.
GIPS® is a registered trademark of CFA Institute. The CFA Institute does not endorse or promote this organization, nor does it warrant the accuracy or quality of the content contained herein.
Alpine Saxon Woods, LLC is an independent asset management firm established in 2022 and based in Purchase, NY. The firm history begins in 2019 with the predecessor firm, Alpine Woods L.P. Alpine Saxon Woods is the parent company of two registered investment advisors, Alpine Woods Capital Investors LLC and Saxon Woods Advisors, LLC. The firm takes a thematic and tailored approach to investing, with a focus on underappreciated growth.
Composite Inception Date: 11/1/18 Composite Creation Date: 10/10/18
Composite Description: The Dividend strategy invests in companies that have maintained or increased dividends for at least the past 5 years. Fundamental research is performed on each company’s ability to sustain its dividend and potentially increase those payments in the future, incorporating analysis on free cash flow potential and numerous balance sheet metrics. The strategy is market capitalization and sector agnostic, but the nature of dividend paying companies tends to tilt towards a mid-to-large capitalization profile.
The composite uses the SPDR S&P Dividend ETF (SDY). The SDY tracks the performance of the S&P High Yield Dividend Aristocrats Index.
Internal dispersion is calculated as the equal-weighted standard deviation of annual gross returns for those portfolios that were included in the composite for the entire year.
Fees include management fee and transaction fees only. The management fee is 1%.
AVAILABLE UPON REQUEST: List of composite descriptions Policies for valuing investments, calculating performance and preparing GIPS reports
From inception through 9/30/23, the composite used monthly dollar weighted returns, adjusting for capital inflows and outflows through Eze Investor Accounting (formerly Penny-It-Works). From 10/1/23 to 12/31/2025, the composite uses daily time-weighted returns from Orion Advisor Technology LLC, which measures performance as a percent of capital at work on each trading day and links them together to produce a return for a stated period.
Results prior to June 30, 2022, are from a predecessor firm, Alpine Woods LP.
Past Performance Does Not Guarantee Future Results
Quick Facts
As of
March 31, 2026
Fund
SMA Inception Date
1/1/2009
Benchmark
S&P Dividend ETF
Strategy AUM
$51.25M
Vehicles Available
Separate Account
Investment Minimum
Negotiable
Fees
Negotiable


The information contained on this website is the property of Alpine Saxon Woods LLC (“ASW”) and is being provided for information purposes only. This website and the information contained herein is not an offer to sell or the solicitation of an offer to buy any securities or instruments, or a recommendation, representation of suitability or endorsement of any security or investment. Since ASW cannot anticipate all the requisites of each individual viewer, there is no consideration given for the specific investment needs, objectives or tolerances of any of the viewers. ASW’s services are provided to a limited number of private investment funds whose offerings are made only pursuant to a confidential private placement memorandum and related subscription documents as well as private wealth management and separately managed accounts. Before making any investment decision, individuals should consult their own advisors, including legal and tax advisors.